关于本页
matplotlib是一个常用的Python绘图包,本页介绍我在使用过程中的一些操作和经验记录,便于日后参考复用。
基本使用
导入包
1
import matplotlib.pyplot as plt
A quick and dirty way - 使用plt.xxx
1
2
3
4
5
A = [1, 2, 3]
B = [4 ,5, 6]
plt.plot(A, B)
plt.title('test title')
plt.show()
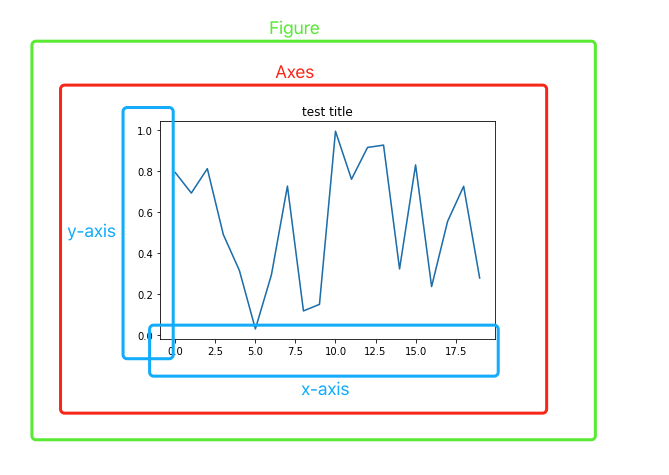
以上代码默认建立一张Figure,在这张Figure上隐式地建立一个axes,然后把内容绘制在这个axes上。
matplotlib要画出一张图真是有N种方式。而plt.xxx尽管方便,但有的功能可能不支持,所以为了方便代码的复用,希望自己稳定地使用一种更加普适的方式。
使用ax.xxx
1
2
3
fig, ax = plt.subplots()
print(type(fig))    # <class 'matplotlib.figure.Figure'>
print(type(ax))     # <class 'matplotlib.axes._subplots.AxesSubplot'>
plt.subplots()的默认值为ncols=nrows=1,故以上代码返回的ax为单一的一个AxesSubplot对象(不可索引),我们可以在这个ax上绘图:
1
ax.plot(A, B)
绘制多图
1
2
3
4
n_rows, n_cols = 2, 2
fig, axes = plt.subplots(n_rows, n_cols)
print(type(axes))
print(axes)
输出为:
1
2
3
<class 'numpy.ndarray'>
[[<AxesSubplot:> <AxesSubplot:>]
 [<AxesSubplot:> <AxesSubplot:>]]
可以看到返回的axes是一个由AxesSubplot组成的numpy.ndarray对象,我们需要使用常规的索引得到对应的ax,然后在其上绘图:
1
2
3
4
axes[0][0].plot(...)
axes[0][1].plot(...)
axes[1][0].plot(...)
axes[1][1].plot(...)
使用for循环:
1
2
3
4
5
for i in range(n_rows):
    for j in range(n_cols):
        axes[i][j].plot(...)     # plot anything you want on the coresponding ax

plt.show()
如果觉得二维的索引写起来有些麻烦,也可以
1
2
3
4
5
for i in range(n_rows * n_cols):
    ax = plt.subplot(n_rows, n_cols, i+1)   # because index in plt starts from 1, so we use `i+1` here
    ax.plot(...)

plt.show()
为图像增加属性
有时需要为图像增加一些属性,如坐标轴label,图的title等。
1
2
3
4
5
ax.set_xlabel('x_label')   # x_label
ax.set_ylabel('y_label')   # y_label
ax.set_title('ax title')   # ax title

fig.suptitle('fig title')  # fig title
绘制曲线
为曲线增加属性
1
ax.plot(A, B, marker='o')
1
ax.plot(A, B, color='b')
matplotlib也支持根据关键字指定颜色,如color=#C6FDFA配色方案参考:配色卡
一个ax上绘制多条曲线并添加图例
1
2
3
ax.plot(A1, B1, label='plot_1')
ax.plot(A2, B2, label='plot_2')
ax.legend()
水平/竖直线
- 水平线:
ax.axhline(y=5, xmin=0.1, xmax=0.9, linestyle="--") - 竖直线:
ax.axvline(x=5, ymin=0.1, ymax=0.9, linestyle="--")
绘制柱状图
给柱状图增加annotation的方案:
绘制直方图
1
ax.hist(dist, bins=n_bins)
绘制带colorbar的(二维特征)图
1
2
3
4
5
6
7
import matplotlib.pyplot as plt
import numpy as np

plt.imshow(np.random.random((100, 100)))
plt.colorbar()
# plt.show()
plt.savefig("colorbar.png")
绘制箱型图
其他
一些操作
保存图像:
plt.savefig(PATH)把图例放在图像外:参考,调节
legend()参数,一个示例如下:1 2 3 4 5
# plt.figure(figsize=(8, 4.8)) # 可能需要调节画布大小,防止图像本身被图例空间过度压缩 # 把图例的左上角对齐到图的右上角 plt.legend(loc='upper left', bbox_to_anchor=(1., 1.)) plt.tight_layout() # 没有这一行,图例可能被裁切掉
关闭坐标轴:
plt.axis('off')解决中文无法显示:参考
1
2
3
4
import matplotlib.pyplot as plt

plt.rcParams['font.sans-serif'] = ['SimHei'] # 步骤一(替换sans-serif字体)
plt.rcParams['axes.unicode_minus'] = False   # 步骤二(解决坐标轴负数的负号显示问题)
图像属性设置
- 设置
Figure大小:plt.figure(figsize=(width, height))- 默认是
(6.4, 4.8)参考
- 默认是
- 设定图像分辨率:
plt.figure(dpi=1200) - 设置字体大小:
plt.rcParams.update({'font.size': 22})- 默认是10,参考